Using marimo with ClickHouse
marimo is an open-source reactive notebook for Python with SQL built-in. When you run a cell or interact with a UI element, marimo automatically runs affected cells (or marks them as stale), keeping code and outputs consistent and preventing bugs before they happen. Every marimo notebook is stored as pure Python, executable as a script, and deployable as an app.

1. Install marimo with SQL support
This should open up a web browser running on localhost.
2. Connecting to ClickHouse.
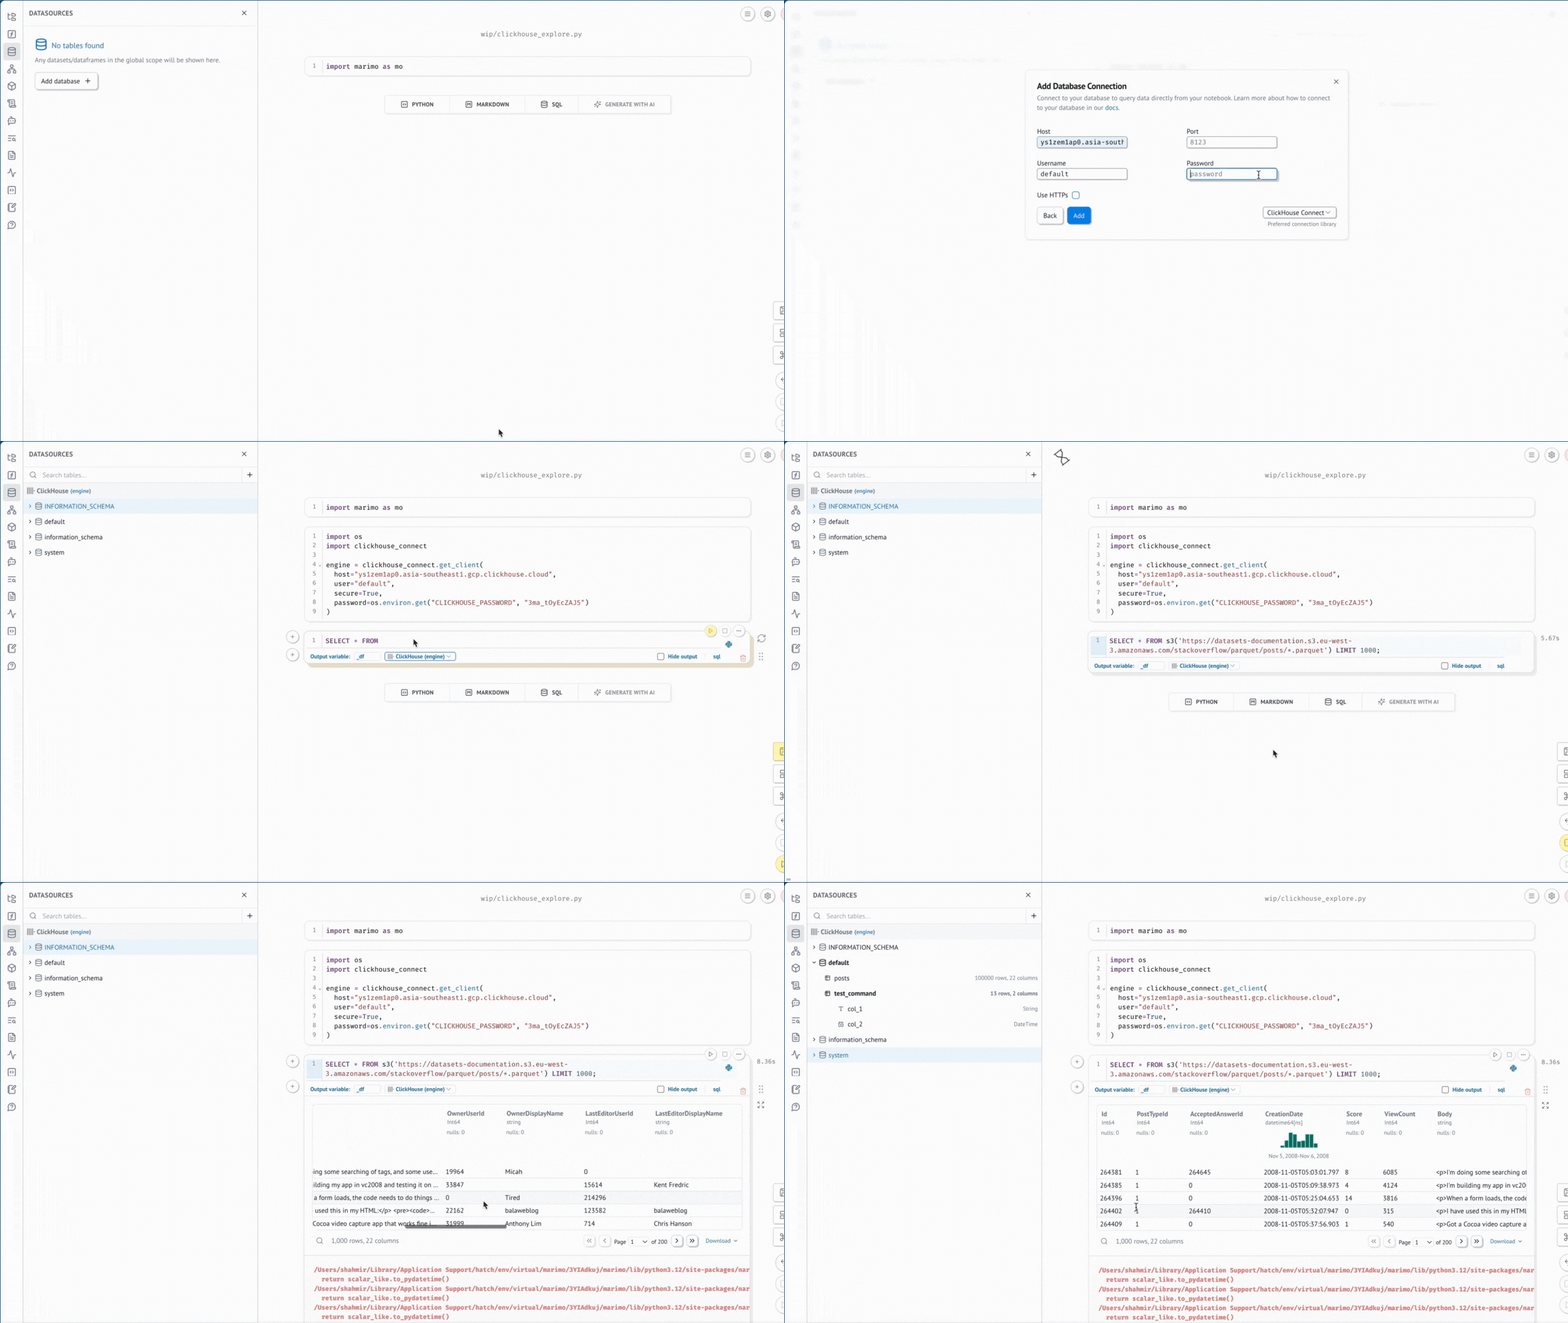
Navigate to the datasources panel on the left side of the marimo editor and click on 'Add database'.
You will be prompted to fill in the database details.
You will then have a cell that can be run to establish a connection.
3. Run SQL
Once you have set up a connection, you can create a new SQL cell and choose the clickhouse engine.
For this guide, we will use the New York Taxi dataset.
Now, you are able to view the results in a dataframe. I would like to visualize the most expensive drop-offs from a given pickup location. marimo provides several UI components to help you. I will use a dropdown to select the location and altair for charting.
marimo's reactive execution model extends into SQL queries, so changes to your SQL will automatically trigger downstream computations for dependent cells (or optionally mark cells as stale for expensive computations). Hence the chart and table changes when the query is updated.
You can also toggle App View to have a clean interface for exploring your data.

